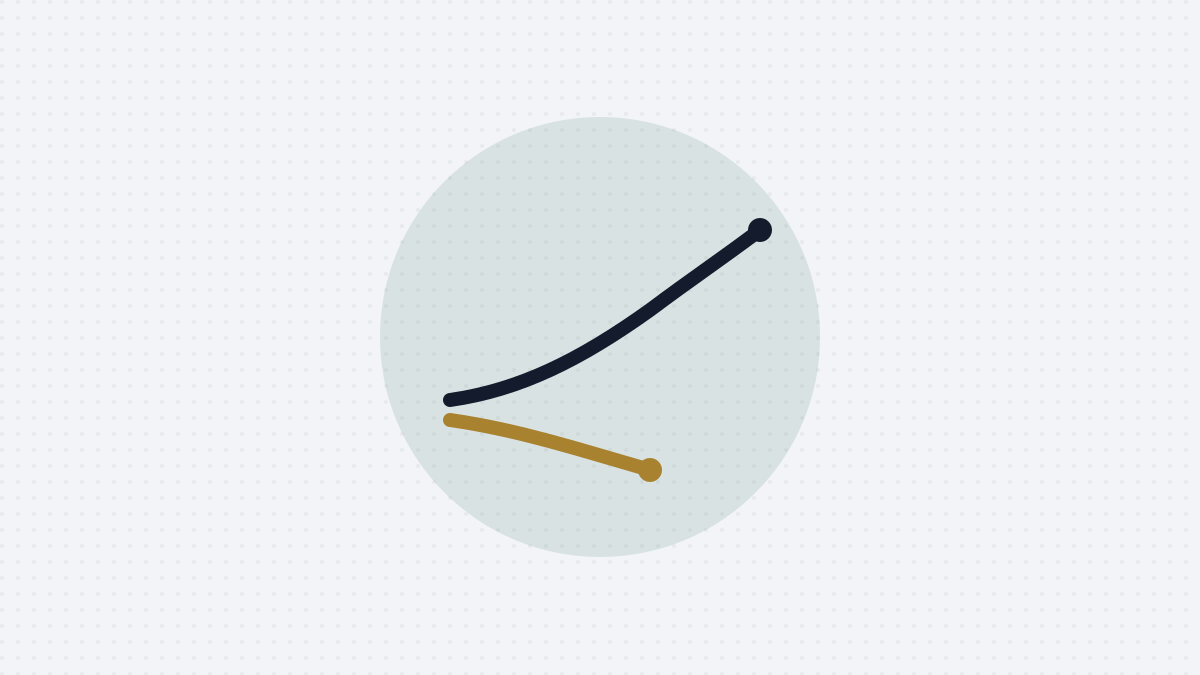
A company can report growing revenue alongside shrinking profit, or growing profit alongside barely-moving revenue. Neither pattern is automatically a good or bad sign on its own — what matters is understanding the specific mechanism behind the gap, which coverage focused purely on the two headline figures often skips past.
Revenue measures activity; profit measures what’s left after costs
Revenue measures the total value of sales generated in a period. Profit measures what remains after every cost involved in generating that revenue is subtracted — and those costs can move independently of revenue for entirely legitimate reasons. Understanding which specific costs are driving a gap between revenue and profit trends is the actual useful question, not simply noting that a gap exists.
Why revenue can grow while profit shrinks
This pattern typically reflects one of a few genuine underlying dynamics: input costs rising faster than a company has been able to pass through in prices, a deliberate strategic choice to sacrifice near-term margin to gain market share, or increased spending on growth initiatives like marketing or new market entry that hasn’t yet generated a proportional revenue return. None of these is automatically a bad sign — a company deliberately investing in growth at the expense of near-term margin can be making a sound long-term decision — but it’s a different story than one where margin compression reflects a genuine loss of pricing power or cost control.
Why profit can grow while revenue barely moves
The reverse pattern — profit growth outpacing revenue growth — typically reflects cost discipline, operational efficiency improvements, or a shift in the mix of what’s being sold toward higher-margin products or services. This can be a genuinely positive sign of a business becoming more efficient, though it’s worth checking whether it’s driven by sustainable operational improvement or by one-off cost cuts that won’t repeat in future periods.
Why margin trends over time matter more than any single period’s gap
A single period’s revenue-profit divergence is considerably less informative than the same pattern observed over several consecutive periods. A company with margins compressing for one quarter due to a specific, identified, one-off cost pressure is telling a different story than one with margins compressing steadily over multiple years, which suggests a more structural issue — declining pricing power, rising competition, or a business model facing genuine cost pressure that isn’t being resolved.
How this connects to reading a company’s fuller financial story
This distinction is one specific, important piece of the broader discipline of reading a company’s financial story properly, beyond the two headline numbers — understanding why revenue and profit are moving differently is exactly the kind of detail that separates a genuinely useful read of company results from simply reporting whether the two headline figures went up or down.
Why this connects to how companies decide where to invest
Margin trends also connect directly to how companies actually decide where to invest available capital, since a company choosing to sacrifice near-term margin for growth is making an implicit capital allocation decision — betting that the investment will generate a sufficient return over time to justify the near-term cost, which is precisely the comparison capital allocation discipline is meant to evaluate.
Why sector context changes how this gap should be read
The same revenue-profit pattern can mean different things in different sectors. A software company investing heavily in growth at the expense of near-term profit is operating in a genuinely different competitive dynamic than a mature retailer doing the same, since the underlying economics of scaling a software business differ meaningfully from scaling a business with significant physical cost structures. Reading a revenue-profit gap without sector context risks applying the wrong interpretive frame entirely.
Why one-off items complicate this comparison further
Layered on top of the genuine revenue-profit divergence patterns described above, one-off items — restructuring costs, asset write-downs, disposal gains — can distort the comparison in a given period without reflecting any underlying change in the ongoing business. This is exactly why company results typically separate statutory figures, including these items, from adjusted or underlying figures that exclude them, and why reading a single period’s revenue-profit gap without checking whether one-off items are involved risks drawing a conclusion the underlying business trend doesn’t actually support.
Why comparing margin trends across a full economic cycle matters most
The most reliable read on whether a margin trend reflects genuine strength or weakness usually comes from observing it across a full economic cycle rather than a single phase of it. A company whose margins hold up reasonably well during a genuinely difficult period for its sector is demonstrating something meaningfully different from one whose margins only look strong during favourable conditions, even if both show similar figures during the good period alone.
What this article is not
This is a general explanation of how to interpret company revenue and profit trends, not analysis or a recommendation regarding any specific company. This isn’t investment advice.
Sources: General corporate finance education and business journalism on margin analysis and company financial reporting.